|
|
||
|---|---|---|
| .idea/.idea.Sharpero/.idea | ||
| Programs | ||
| .gitignore | ||
| Program.cs | ||
| README.md | ||
| Sharpero.csproj | ||
| Sharpero.sln | ||
| Sharpero.sln.DotSettings.user | ||
| global.json | ||
| sharpero.png | ||
README.md
Sharpero
This is an implementation of an Interpreter/Compiler for the Prospero challenge, implementing some basic optimizations including removing constants from the instruction tape, vectorization, parallelization but also optionally compiling the loop of the evaluator to CIL prior to invocation.
It doesn't perform any sophisticated interval-arithmetic based optimizations (... yet), it's a brute-force approach.
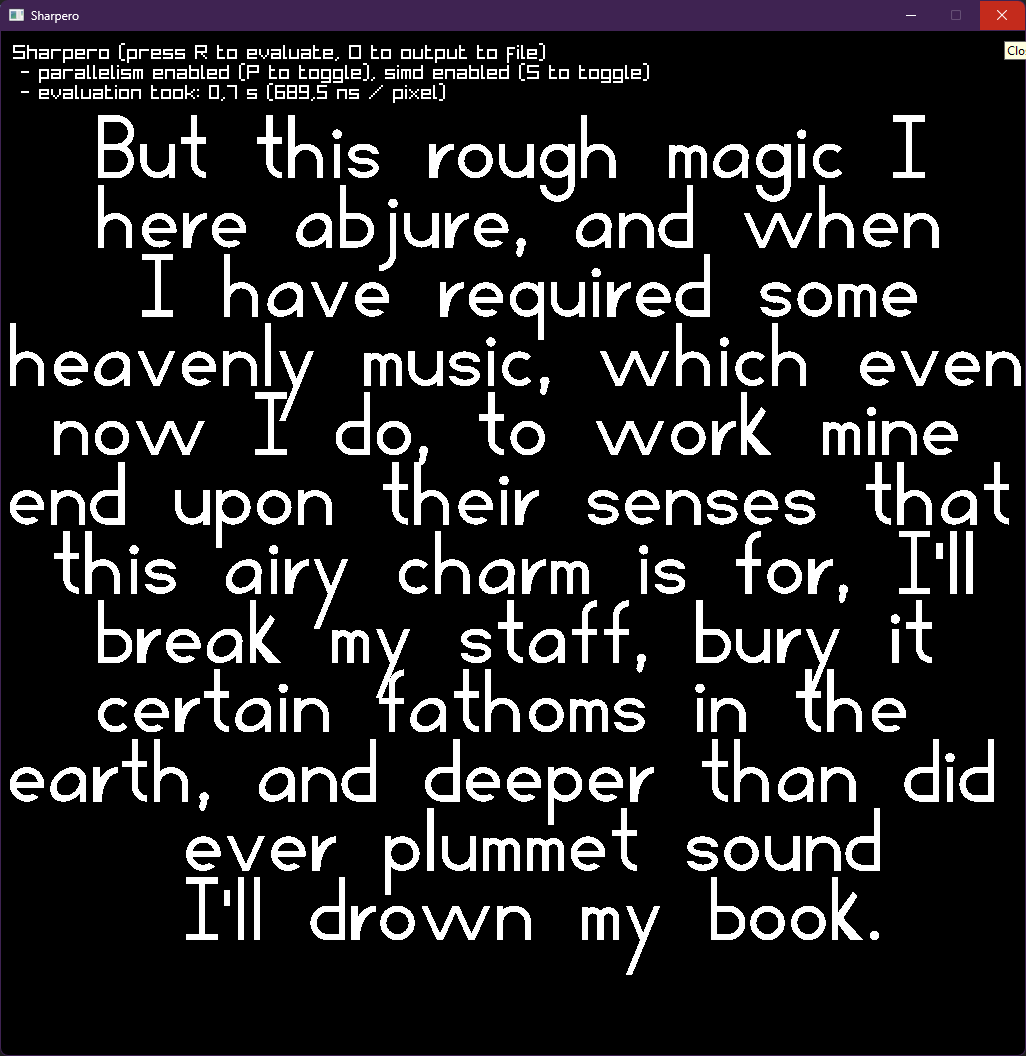
This program is also an interactive visualizer of the rendering process, allowing you to see exactly how it's writing the image data out, and toggle vectorization, parallel execution, compilation on/off and observe the effects on runtime.
Interesting Things
Compilation to CIL
When attempting to compile the inner loop (flattening the instructions into a big C# function) I ran into limits where making functions too large made the JIT quite unhappy (either because it physically refuses to make functions with more than 65 kilobytes of CIL), or because it simply performed quite poorly when jitting large functions, so I ended up with an experimentally derived "max instructions per chunk" which ends up splitting the generated inner loop into a number of subfunctions, as many subfunctions as are needed, and the final program ends up being something like:
void EvaluateLoop()
{
    EvaluateChunk1();
    EvaluateChunk2();
    EvaluateChunk3();
    // ... etc, with the current program and chunk size, this ends up being about 200 of these subprograms being generated
}
RyuJIT Implementation Details
When the C# JIT observes a pattern like this:
[MethodImpl(MethodImplOptions.AggressiveInlining)]
public static T Add<T>(T a, T b)
    where T : unmanaged
{
    if (typeof(T) == typeof(float))
    {
        return Unsafe.BitCast<float, T>(Unsafe.As<T, float>(ref a) + Unsafe.As<T, float>(ref b));
    }
    else if (typeof(T) == typeof(Vector<float>))
    {
        return Unsafe.BitCast<Vector<float>, T>(Unsafe.As<T, Vector<float>>(ref a) + Unsafe.As<T, Vector<float>>(ref b));
    }
    else
    {
        throw new InvalidOperationException();
    }
}
... which to the normal C# eye would seem like you'd end up with a runtime branch every time this runs right? However because C# JIT implementations (RyuJIT included) monomorphizes generics when T is a value type, we end up with different versions of this function, and whenever it compiles one of these functions where it branches over types and typeof(T) along with branching over types is a specific pattern the JIT recognises, we actually end up with a function without any branches after the JIT has compiled the function for us. Fun!
... Good for us, because I abused this pattern a lot in this program in order to make it easy to toggle on/off vectorization!
The Program
How do I run it?
You'll need .NET 10, with dotnet run -c Release that should be all you need.
The only dependencies are RayLib-Cs (for the interactivity) and SkiaSharp (for writing out the image).
(Crude) Benchmark Results
On my own machine (CPU: Ryzen 7 4800HS), the results tabulate roughly as follows.
| Compilation | Parallelism | Vectorization | Evaluation Time | Compilation Time |
|---|---|---|---|---|
| enabled | enabled | enabled | 0.2s | 0.2s |
| enabled | enabled | disabled | 1.3s | 0.2s |
| enabled | disabled | enabled | 1.7s | 0.2s |
| enabled | disabled | disabled | 10s | 0.2s |
| disabled | enabled | enabled | 0.7s | N/A |
| disabled | enabled | disabled | 5.0s | N/A |
| disabled | disabled | disabled | 48s | N/A |
Recommendations
Probably don't use this with some kind of agentic LLM workflow, bad things might happen :)
Don't say I didn't warn you.
License
MIT/X11